Analytics & Full Data Export
View your product and shipping protection sales and attach rate analytics.
You can view your business performance within the Merchant Portal, including key metrics like warranty sales, warranty performance, attach rate and more.
This feature may need to be enabled by your MSMThe Analytics tab and data generation must be enabled by the Extend team.
Product Protection Analytics
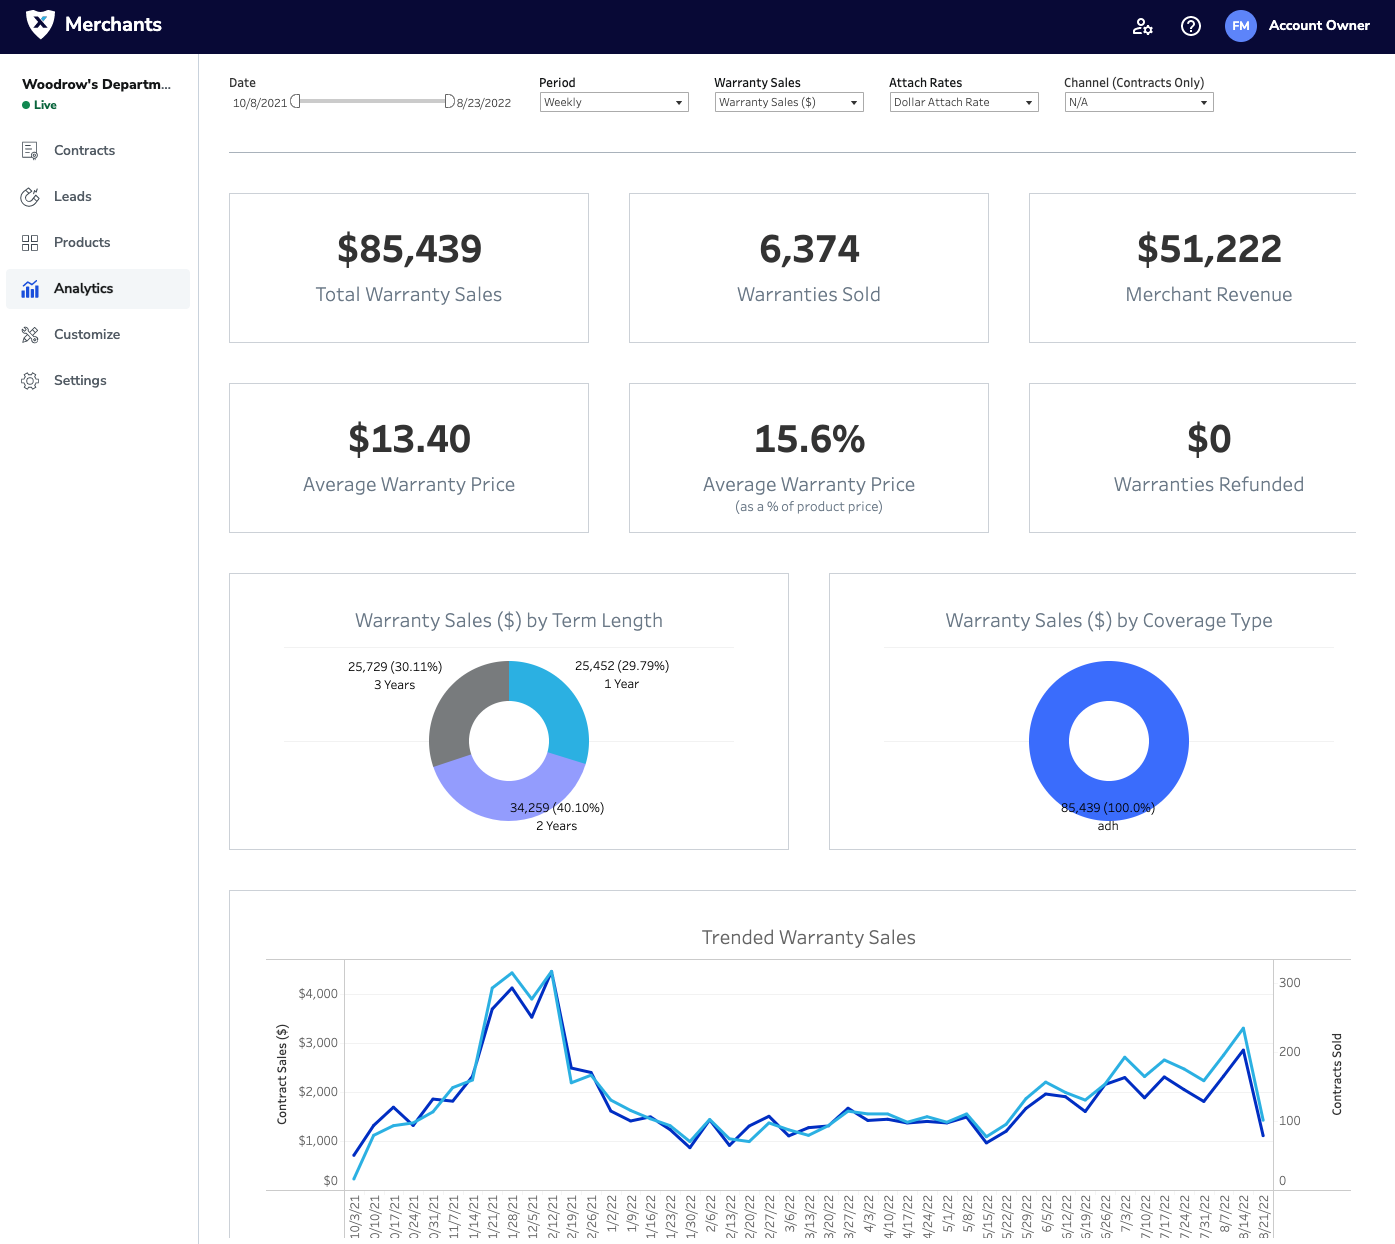
Your product protection analytics report gives you access to the following performance data:
- Total Warranty Sales ($)
- By Term Length (i.e. 1 Year, 2 Years, 3 Years)
- By Coverage Type (i.e. ADH, Base)
- By Channel (i.e. "call center", "telesales", etc.)
- Over Time Period (i.e. Weekly, Monthly, Quarterly)
- Total # Warranties Sold
- Over Time Period
- Merchant Revenue ($)
- Average Warranty Price ($)
- Average Warranty Price (as % of product price)
- Warranties Refunded ($)
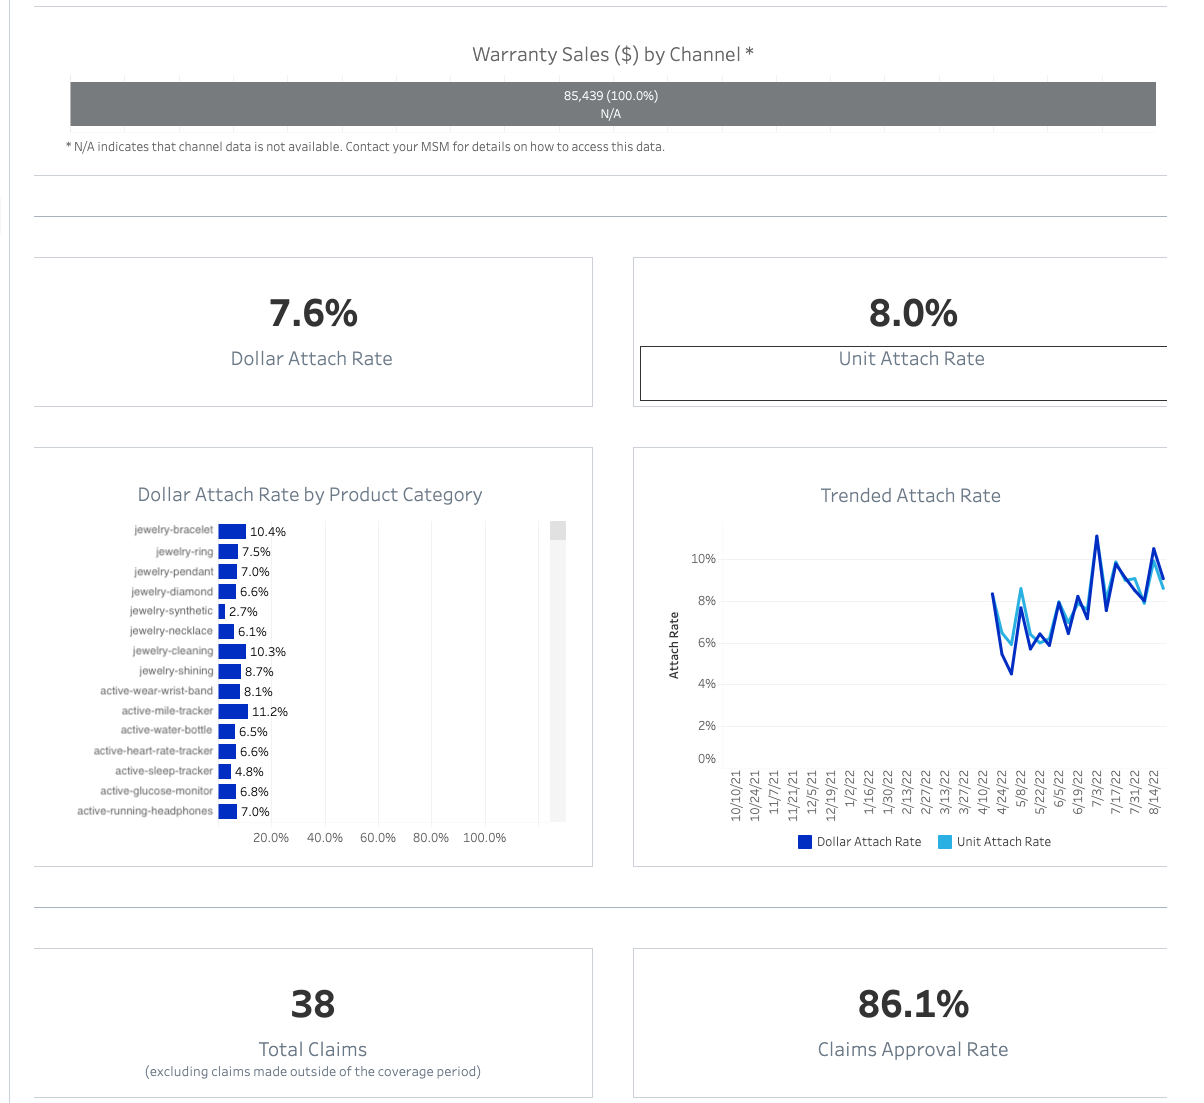
- Dollar Attach Rate (%)
- By Product Category (i.e. "e-bike", "jewelry", etc.)
- Over Time Period
- Unit Attach Rate (%)
- Over Time Period
- Total # Claims (excludes claims outside coverage period)
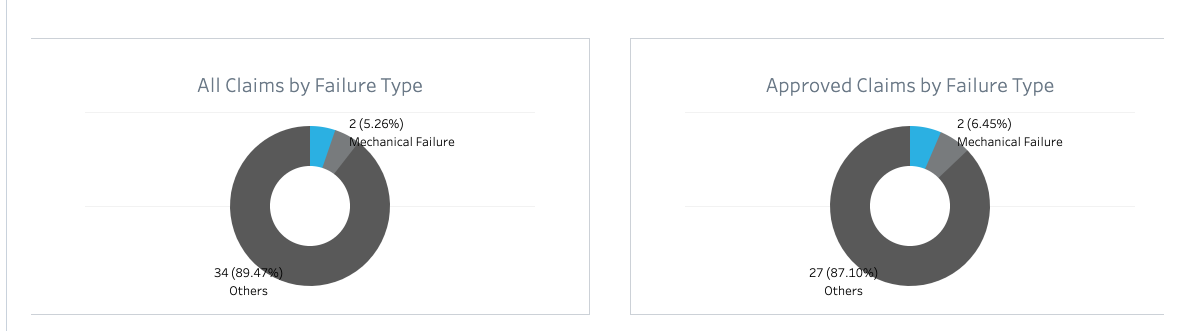
- By Failure Type (i.e. "Water Damage")
- Claims Approval Rate (%)
- # of Approved Claims
- By Failure Type (i.e. "Water Damage")
To view your Product Protection analytics:
- Log into the Merchant Portal
- On the left navigation bar, click on Analytics
- Click on the "Product Protection" tab
NoteThis data is NOT real-time and is best used for look back and trend reporting. The Analytics dashboard leverages the Extend data warehouse infrastructure which typically lags by one or two days. For real-time and current data, please refer to the transaction pages (Contracts, Leads, Claims) which are updated every time the page is refreshed.
Shipping Protection Analytics
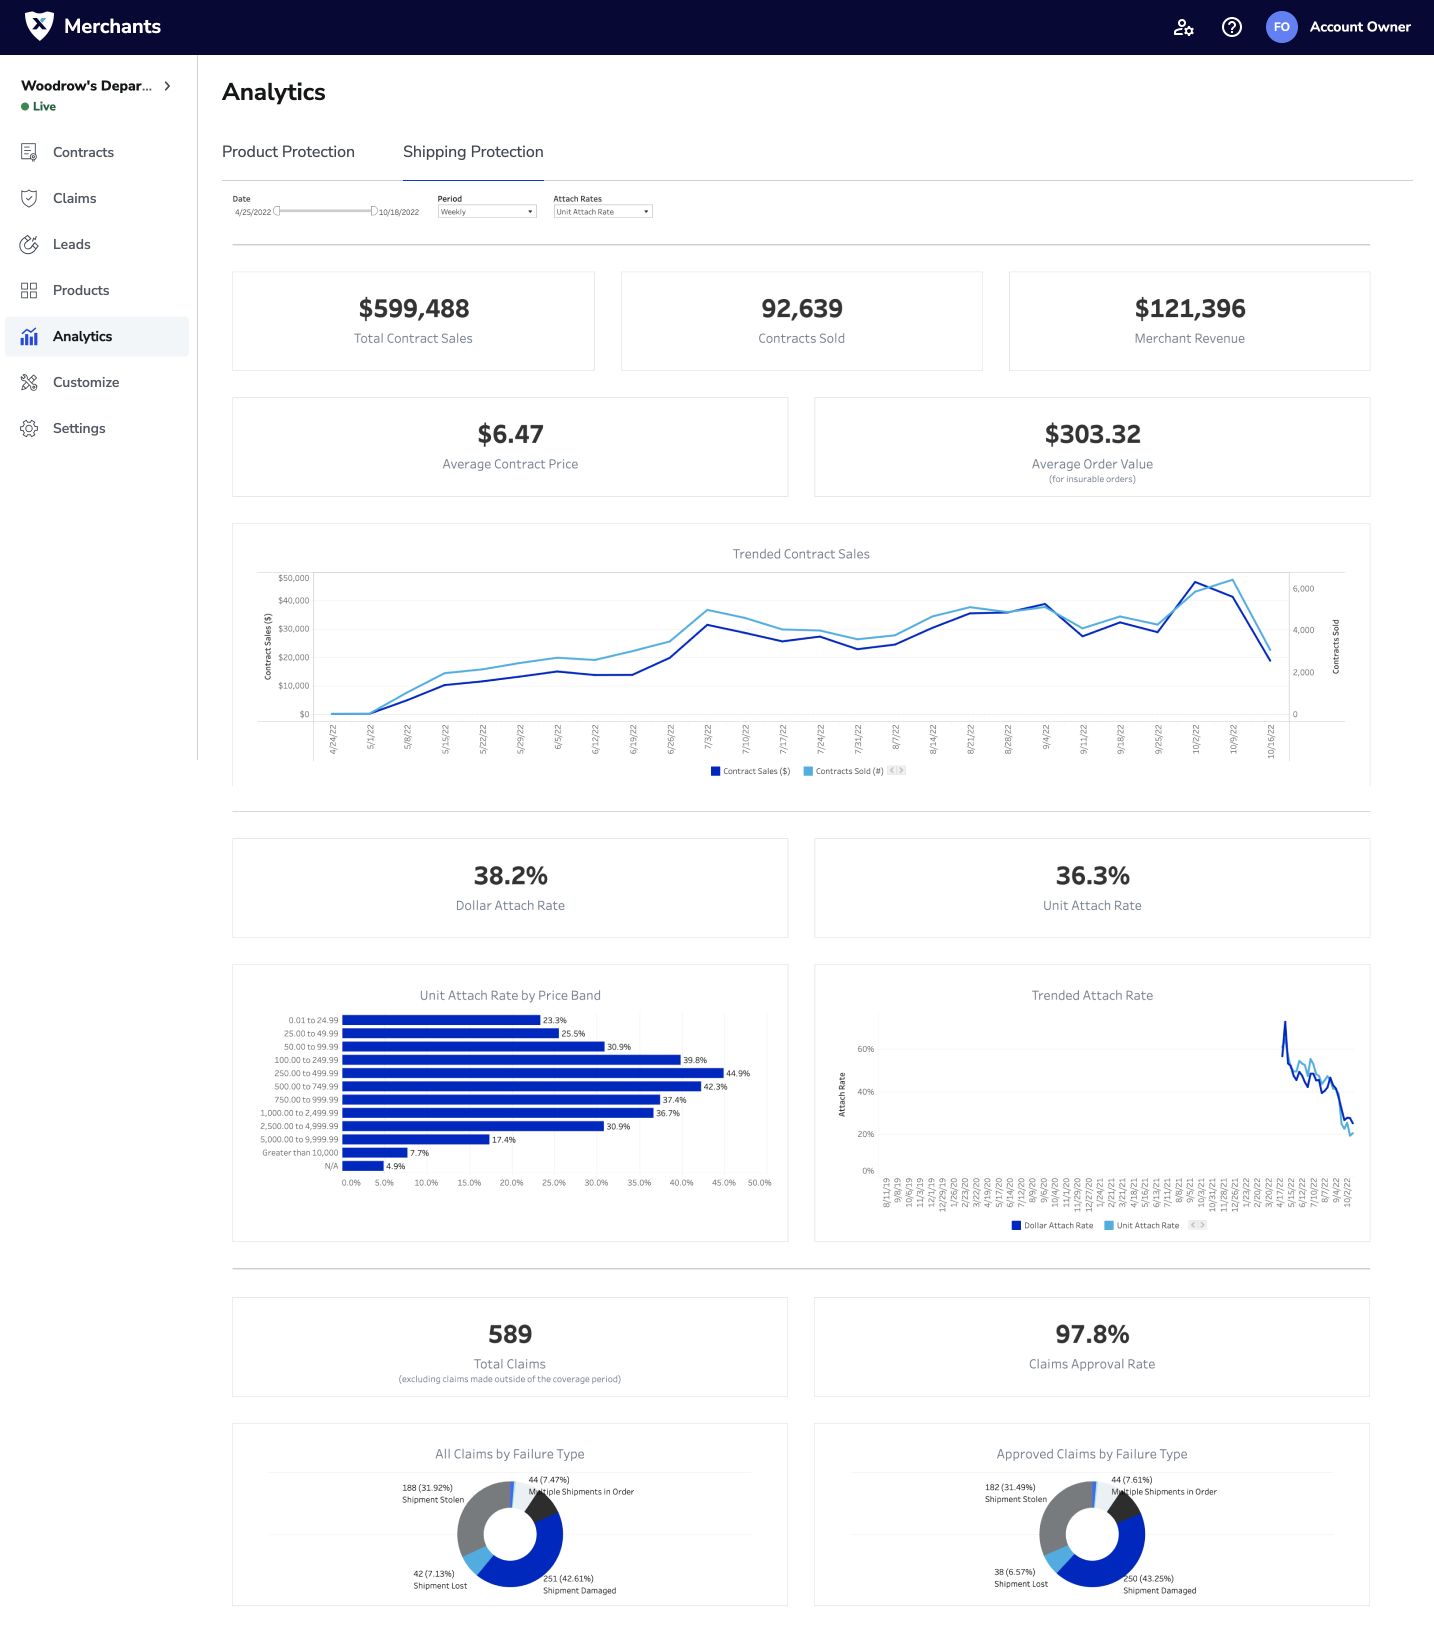
Your shipping protection analytics report gives you access to the following performance data:
- Total Contract Sales ($)
- Over Time Period (i.e. Weekly, Monthly, Quarterly)
- Total # Contracts Sold
- Over Time Period (i.e. Weekly, Monthly, Quarterly)
- Merchant Revenue ($)
- Average Contract Price ($)
- Average Order Value ($)
- Unit Attach Rate (%)
- Over Time Period (i.e. Weekly, Monthly, Quarterly)
- By Price Band
- Total # Claims (excludes claims outside coverage period)
- By Failure Type (i.e. "Shipment Stolen")
- Claims Approval Rate (%)
- By Failure Type
To view your Shipping Protection analytics:
- Log into the Merchant Portal
- On the left navigation bar, click on Analytics
- Click on the "Shipping Protection" tab
NoteThis data is NOT real-time and is best used for look back and trend reporting. The Analytics dashboard leverages the Extend data warehouse infrastructure which typically lags by one or two days. For real-time and current data, please refer to the transaction pages (Contracts, Leads, Claims) which are updated every time the page is refreshed.
Full Data Export
Full Data Export gives you the ability to export Contracts, Leads and Claims from your Extend account. In order to perform a data export:
- Log in to the Merchant Portal using either the Merchant Portal Admin or Merchant Transaction Manager role.
- On the left navigation bar, click on Analytics
- Click on the "Full Data Export" tab.
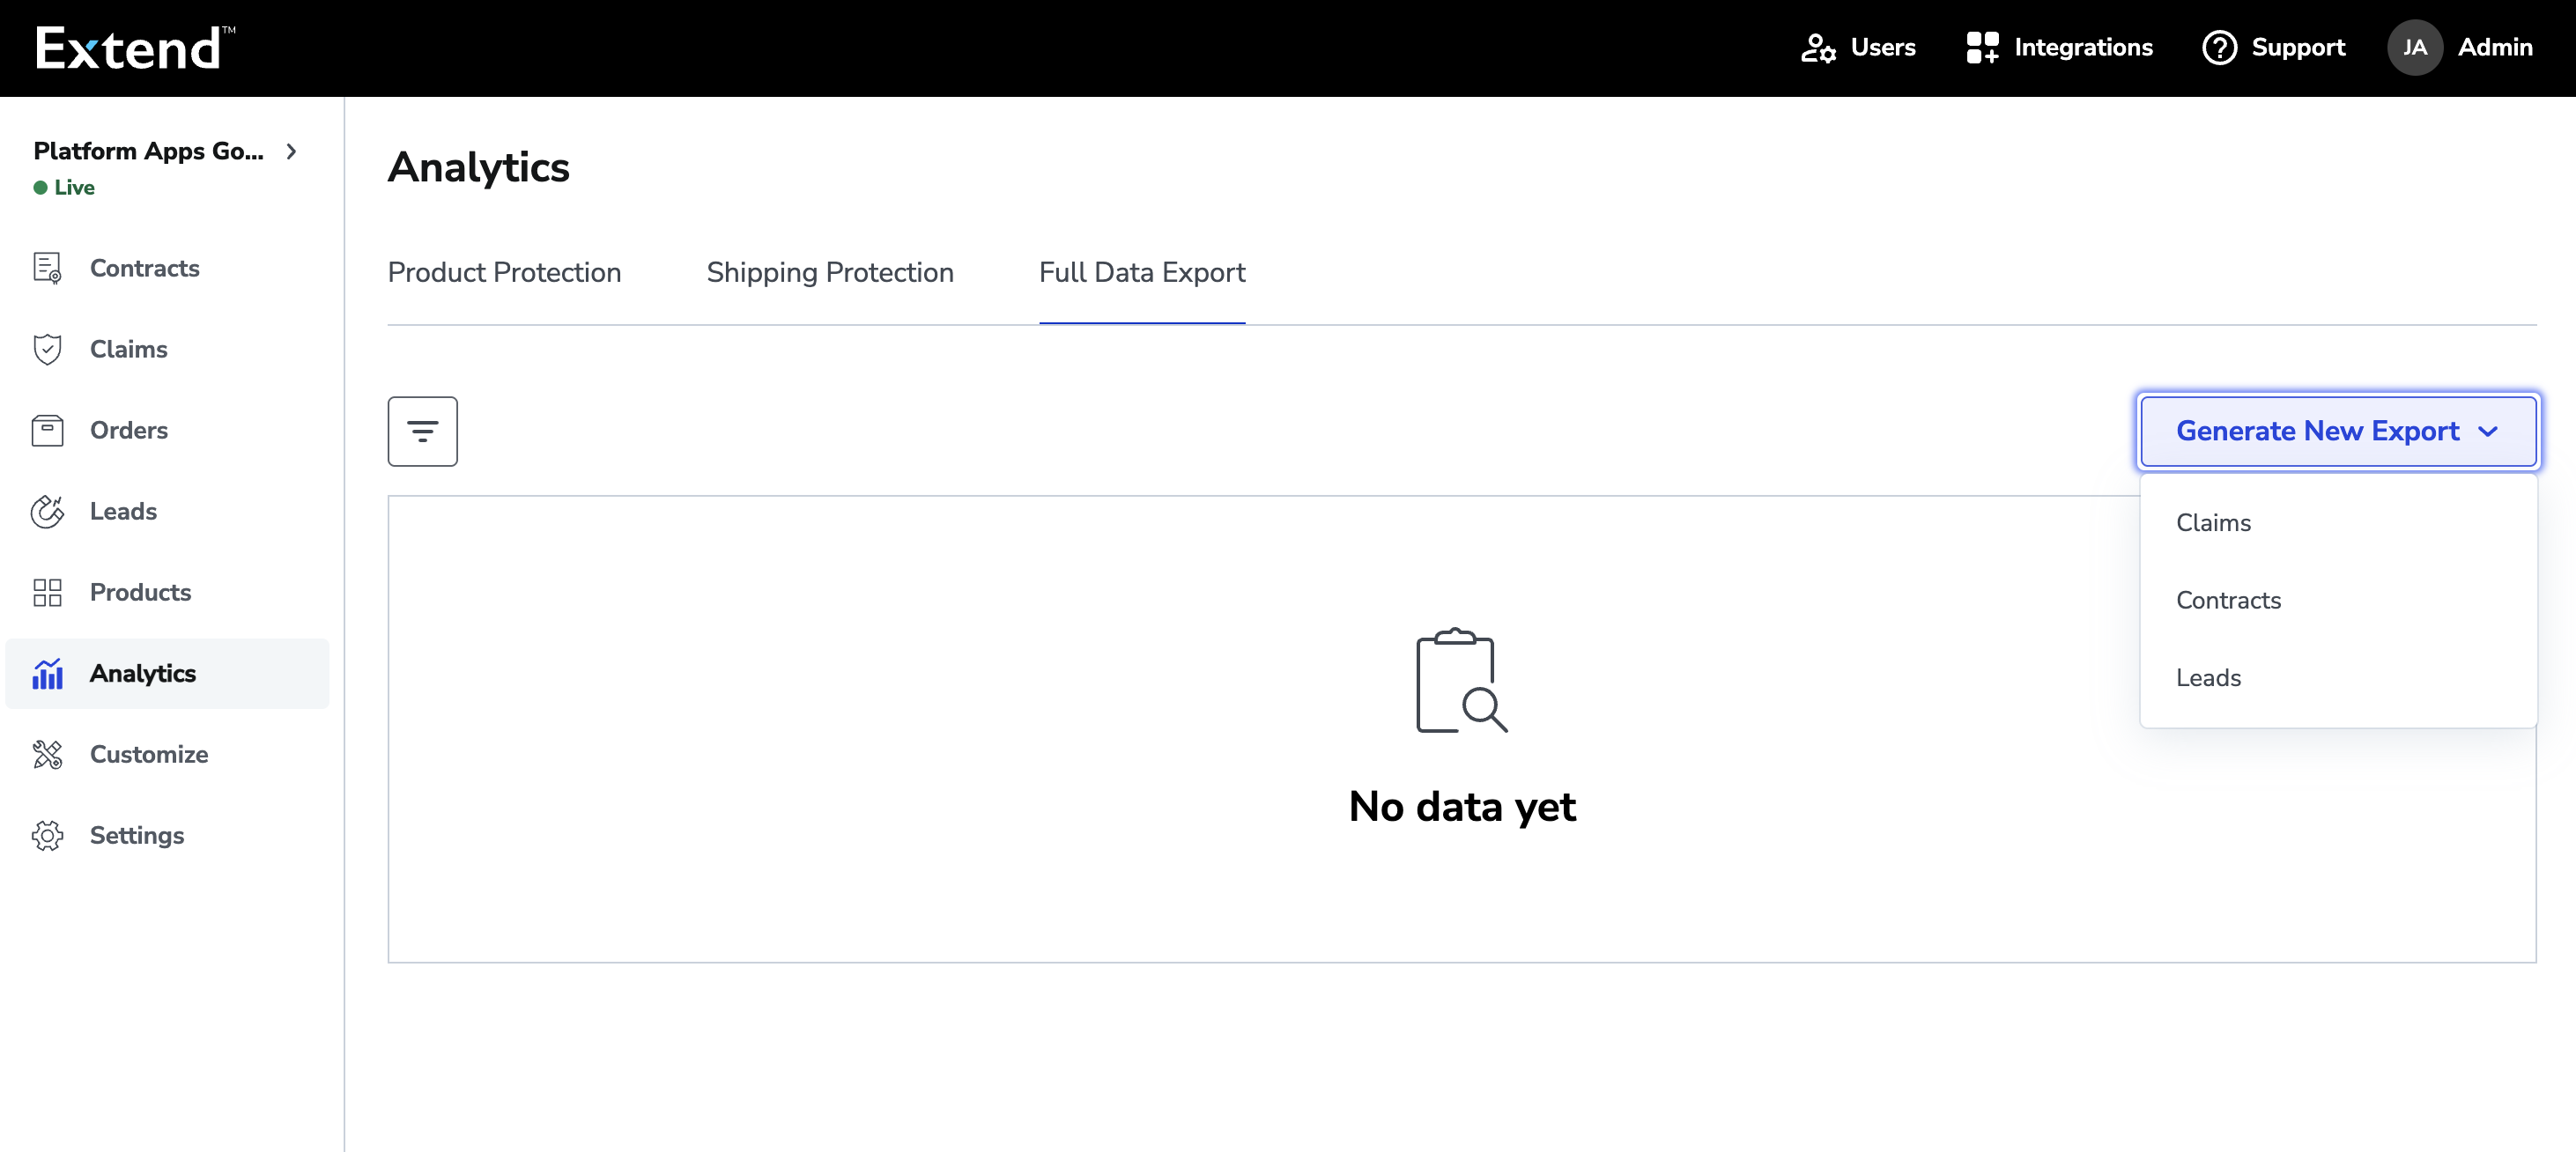
-
Under "Generate New Export", select the data type you would like to export.
-
Select the filter criteria for the data you would like to export:
- Select "All" or a custom date range.
- If export Contracts, select "All" or a specific contract type.
- Select the specific data columns to include in the export. None are selected by default.
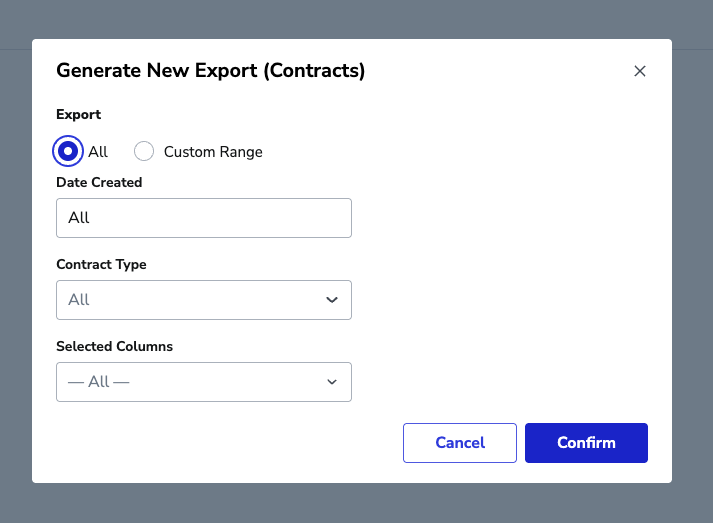
- Click Confirm to generate your data export. You will see a toast message indicating that your export is processing.
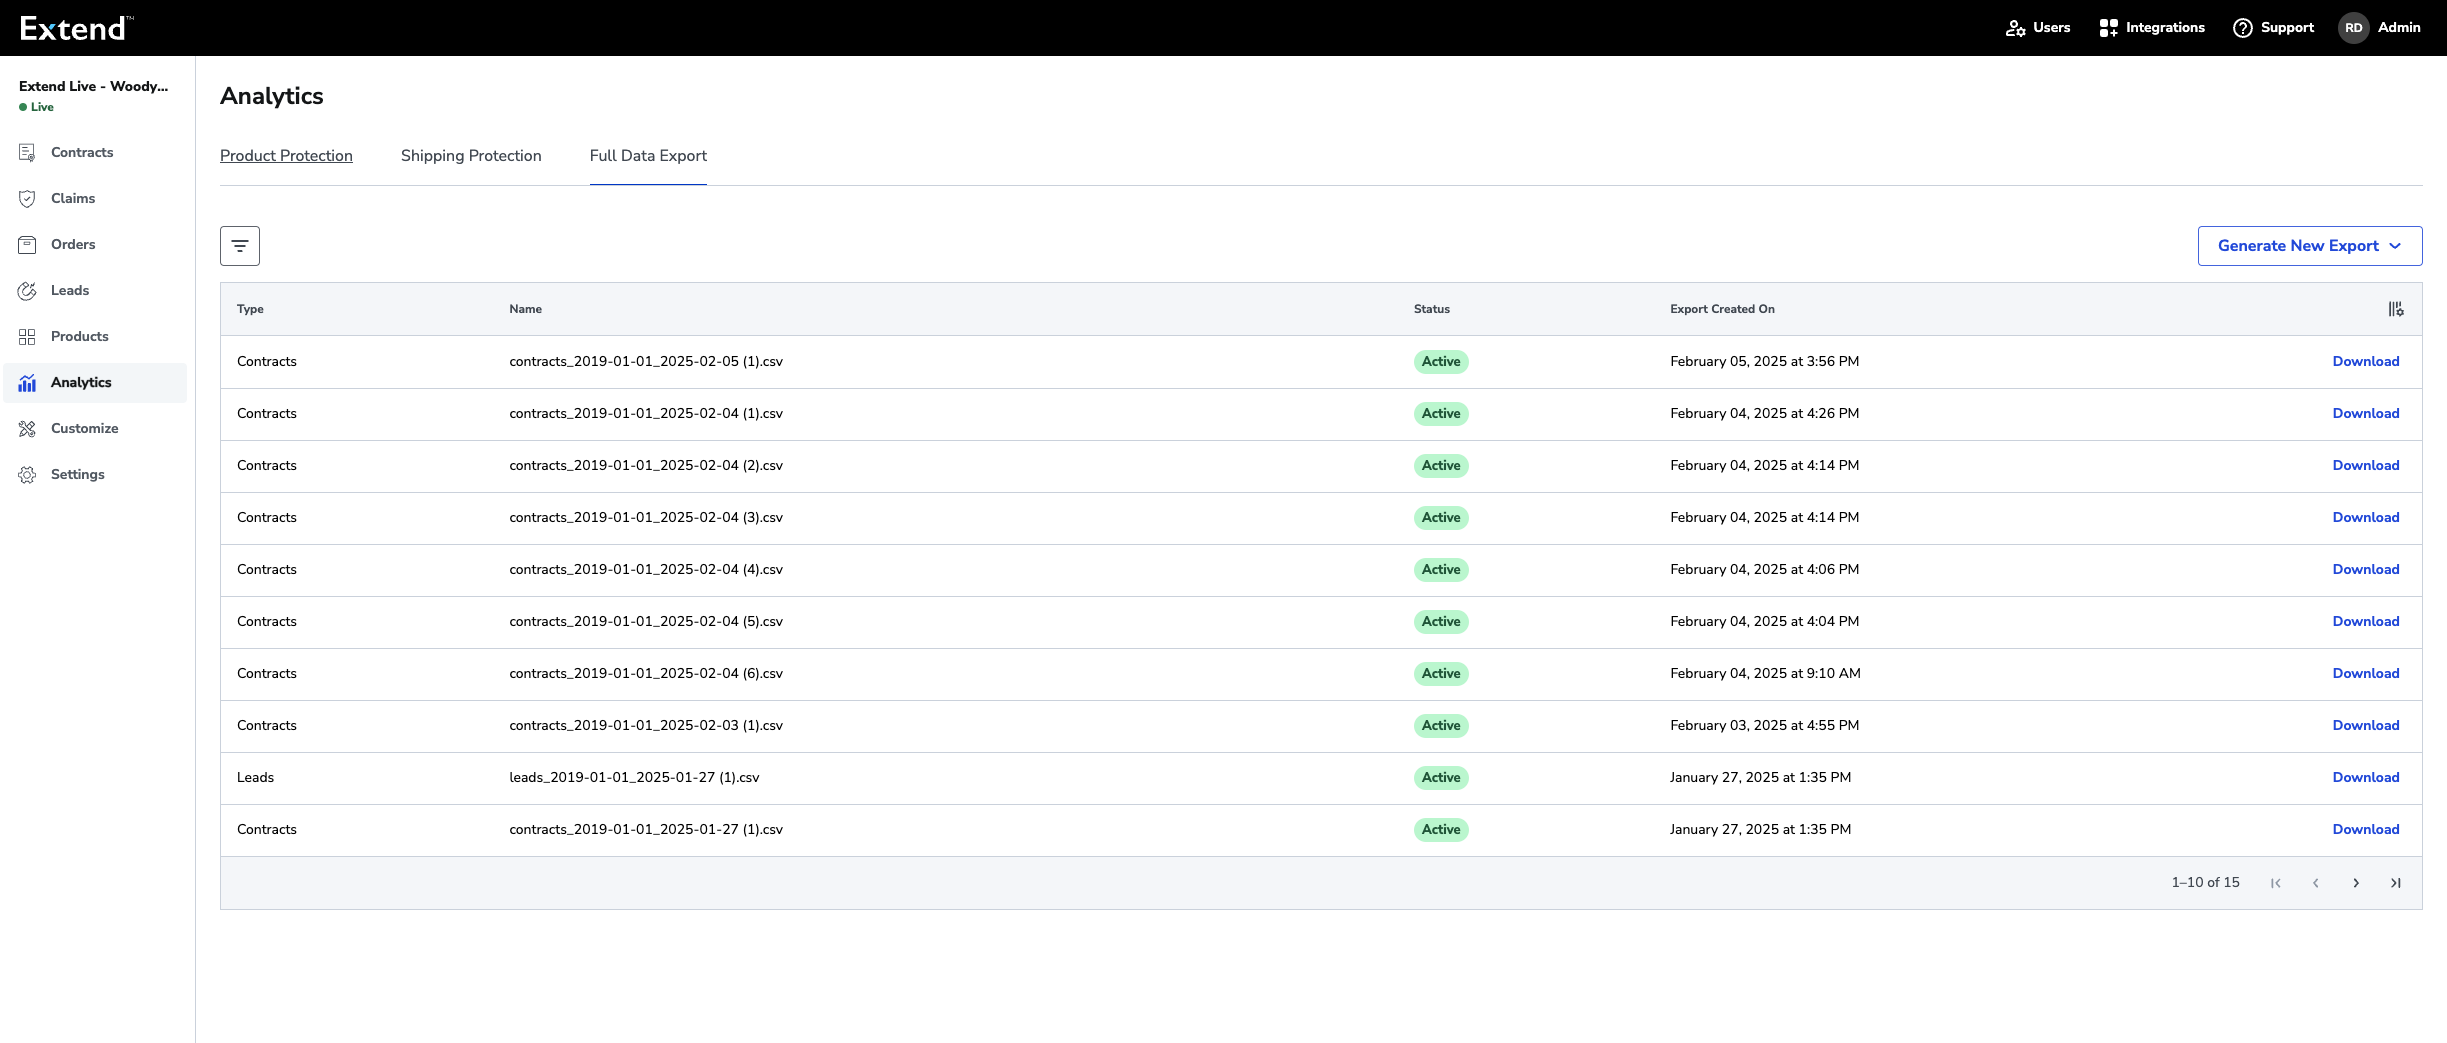
- Once your data export is complete, a link to the export will be visible within the export list. You will also receive an email with a link to your export once it is available. This email will be sent to the user who initiated the export.
NoteThis data is NOT real-time and is best used for look back and trend reporting The Full Data Export leverages the Extend data warehouse infrastructure which typically lags by one or two days. For real-time and current data, please refer to the transaction pages (Contracts, Leads, Claims) which are updated every time the page is refreshed.
Updated 10 months ago